A pivot is a change in one or more of your company’s value propositions: PRODUCT, MARKET or BUSINESS MODEL. Choosing which, when, and especially how to change the direction of your company inevitably involves a lot of gut decisions. Measuring the success of that pivot accurately is fundamental to know if the path you chose is correct.
Our company, Slidebean is an online presentation software that takes your content and automatically formats it into an awesome deck, no manual design required. Slidebean has gone through two major pivots in the past year. The first took place during our time at 500 Startups. We changed our pricing (BUSINESS MODEL) significantly, which inadvertently ended up changing our MARKET as well. More recently, we made a new change in our BUSINESS MODEL and PRODUCT, which spiked a new and steeper growth curve.
As the point person on growth and metrics at Slidebean, analyzing CAC, LTV, MRR Growth and Churn has become part of my daily routine. Whatever your business is, make sure you have an assigned stakeholder looking at the data, dropping it in spreadsheets and tracking performance. For us, it’s proven to be the most efficient and safe way to make decisions.
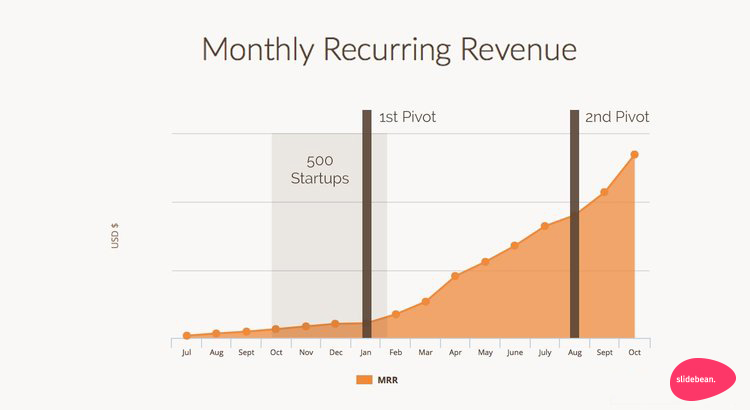
To get started, take a look at our growth chart since our Jul 2014 launch.
Round 1: Launch and Initial Revenue
Our go-to market strategy was to start with individual users and move our way up to larger businesses, which seemed to make a lot of sense to everyone at that point. We started gathering traction (or so we thought) 3 months after going live.
We were signing up around 2,000 new users per month, with a 20% activation rate and a ~3% conversion to paid. This results in a funnel that looked like this:
New Signups/mo: 2,000
New Active Users: 600
New Paying Users: 60
New monthly MRR: ~$300
By September 2014 most of the new signups were coming organically, mainly from word of mouth or referrals from our current users. Presentations are intrinsically shareable and this was attracting a decent amount of traffic. Each completed presentation was generating an average of 1.21 new signups. We figured that the key to growth was to continue fueling that organic engine.
We overlooked two core issues:
- While subscription rate was not bad (again, 3%) churn was around 25% which is absurdly high:that meant an average user would stick for only 4 months. With a pricing of $5-6, this resulted in an LTV of ~$20. Users were only subscribing to build one or two decks, and then cancel because they didn’t need the product anymore (a MARKET issue).
- Due to low LTV (lifetime value) per user, the maximum amount of money we could spend to get a paid user was ~$7 (as a SaaS standard, LTV should always be greater than 3x CAC, or cost per acquisition cost). With a 3% conversion rate to paid, we could only afford to spend a few cents per sign up, which is basically impossible (a BUSINESS MODEL issue).
We believed in our organic growth engine so much that we assumed we were on the right track. The first one to point out an issue was our 500 Startups POC. She challenged us to find a promising scalable, sustainable growth channel in the course of 2 weeks. In other words, if we had $10K, how would we spend them to make $20K?
Changing our pricing by 30x
We could not afford to get a paid user for $7. Our organic engine didn’t work, because it was not scalable.
We reluctantly agreed to test the price sensitivity of our users. We had settled on $5-6 because it was competitive against Office 365, Google Docs and Prezi, and because we didn’t believe anyone would be willing to pay more than $5, while there are cheaper alternatives in the market.
We set-up 4 different pricing pages with the following pricing options:
A: $4.99 and $5.99 monthly subscriptions with discounted yearly plan (original pricing)
B: $44.99 an $54.99 yearly subscriptions (no monthly option)
C: $19 and $29 monthly subscriptions with discounted yearly plan
D: $119 and $199 yearly subscriptions (no monthly option)
We split our pricing page traffic using Optimizely, and after 2 weeks we had these results:
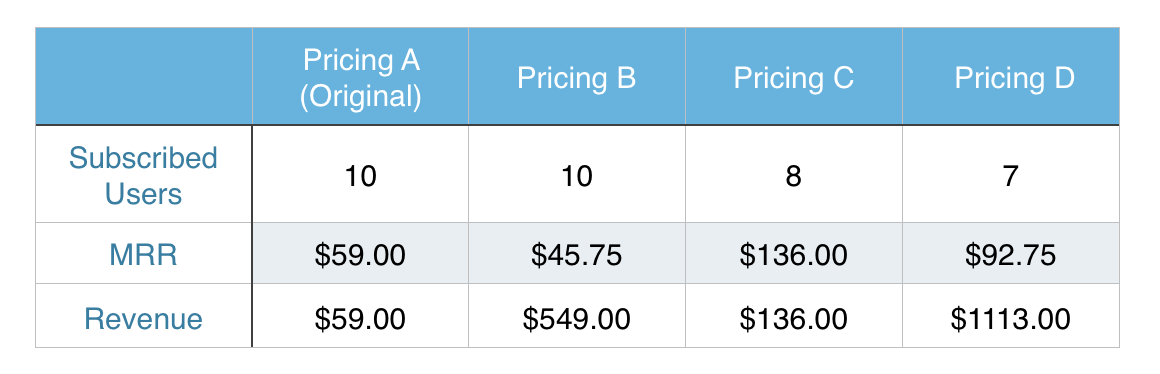
- The number of users that subscribed to each plan was fairly similar.
- Revenue on option D was 18x compared to our original pricing. The huge difference in revenue was a clear indication that we were on to something.
- Pricing C also seemed promising because it brought the most MRR, but since our historic churn was 20-25%, the LTV of those users would’ve been lower than Pricing D.
We changed our pricing (to option D) and started investing in paid advertising, aware that we were now able to spend around $100 to acquire a new customer and still turn a profit on the first transaction.
Inadvertently, this pivot in BUSINESS MODEL also represented a pivot in MARKET. The type of users that were willing to pay $199/yr for the platform were very different from the audience willing to pay $5/mo. Users from small businesses and startups started showing up in our dashboard, which cut students and teachers out because of the elevated cost. We implemented Live Chat support from Intercom, which pointed us towards this insight.
PRODUCT: Slidebean: Presentations that Design Themselves
MARKET: B2B – Small Businesses
BUSINESS MODEL: Freemium platform, free limited plan and premium plans at $119 and $199.
After taking a close look at these users, we decided to re-experiment with monthly pricing. We figured a smaller ($19/$29) up front cost would make the transition easier.
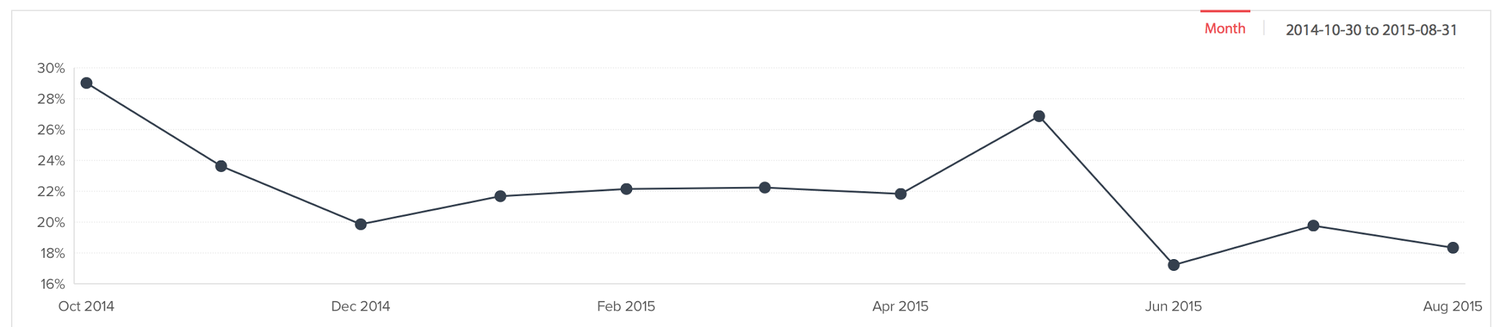
Cancellations and Churn
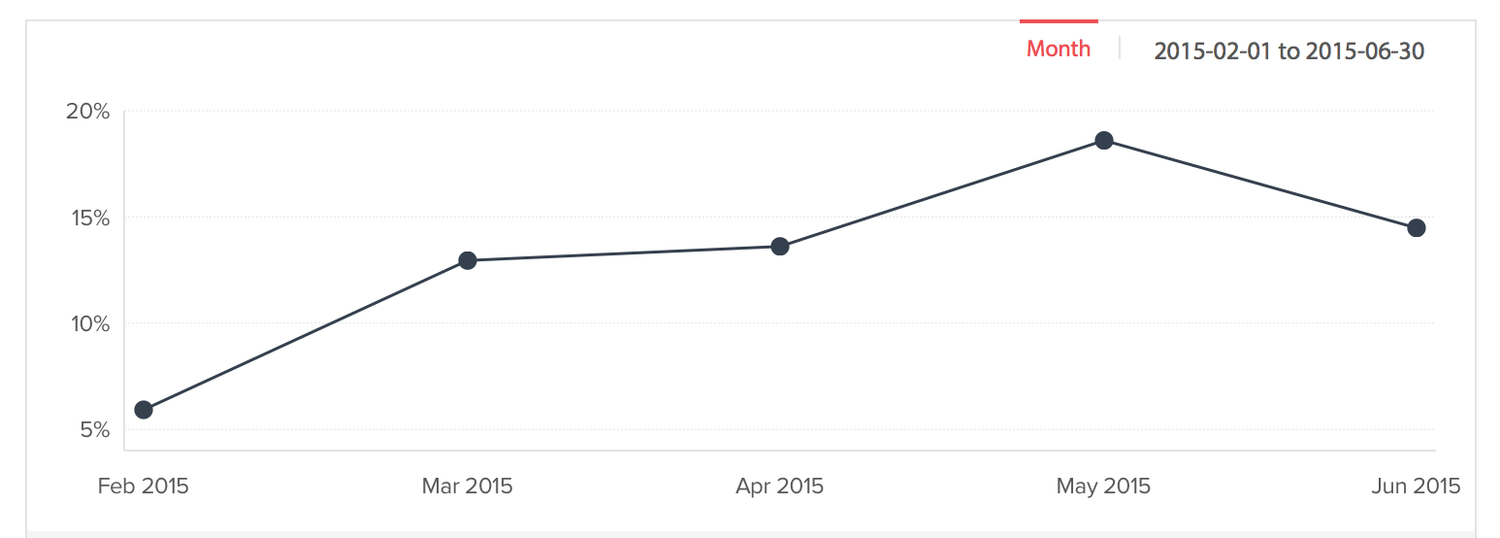
Re-enabling monthly plans allowed us to subscribe and onboard users relatively easy, but churn was a large concern. We were able to bring churn down to 5% (by offering only yearly plans), and monthly MRR (monthly recurring revenue) churn spiked back to ~20%. We used ChartMogul to measure this, because it differentiates between Gross Churn and Net Churn, which takes into account reactivation and expansion MRR.
While our LTV was significantly higher than before ($150-$200 in June), it still limited our CAC to ~$60-75, which while nice, gave us little flexibility to bid on competitive keywords in Google AdWords. Furthermore, one should always assume that faster growth will increase CAC.
As our Live Chat support became more and more efficient, we disabled the self-service cancellation in Slidebean: users were required to speak to our team before they cancelled. We created incentives for our chat support team to prevent user cancellations, and started tracking every cancellation and the reasons behind it.
The most common reason was technical: bugs or issues with the product. Our dev team worked hard to patch them, and we started to see a decrease in product-related churn.
Another popular cancellation reason was that users no longer needed the premium features on the product. Our premium features at this time included enabled PDF exports, custom branding and extra design templates. We noticed many people subscribing for a month or two, using the export features and then cancelling. Another common reason, based on feedback from the unsubscribe form was that they ‘ didn’t feel the premium version significantly better than the free version.
This was a revelation of a deeper underlying problem with our product and business model. Users felt OK cancelling and reverting their accounts to free, because they knew that they could just activate again later and download any presentations that they needed.
So do we try to force a behavior in our users? Or do we adapt to them (by implementing pay-per-download, for example)?
Half Measures
After taking a deeper look at our data, we noticed that around 50% of our paying users were building no more than 1 or 2 presentations per month. Some of then cancelled, some of them didn’t. This pretty much discarded the possibility to charge on a per presentation or per download basis. Crunching the numbers, we’d have to charge $10-$20 per presentation to keep a healthy revenue stream.
This shed some light on the behavior of our users: on average, they didn’t need to create new presentations as often as we thought when we pivoted to B2B. A good % of users kept their accounts active even though they didn’t use the platform that often, but others cancelled with the plan to re-subscribe later.
Another behavior we noticed was users sharing a single account and password. If they were part of a small team, they preferred to use the same account rather than pay for two separate plans. The collaboration features didn’t add enough value to pay twice or thrice the price of a single subscription.
With these metrics in mind, we figured the solution to stop churn was finding ways to add more value to the product.
- We converted our plans into ‘team’ plans, that allowed users to add up to 5 team members at no additional cost (they were sharing they account anyway).
We started implementing features so that users would be motivated to keep their account active. The main one was Presentation Insights, which tracks the viewers and their activity on the presentation, and only works if you are an active paying customer. These alternatives worked to a certain point. By August we were tracking one of our lowest points in churn, but it was still in the double digits (very bad!).
Full Measure: From Freemium to Premium
Part of the team leaned towards just flipping the switch and going premium. But but being able to measure the actual conversion/churn improvement was a major priority for me. Comparing data from different points in time would not have been ideal, so the A/B test had to be simultaneous.
After a lot of push back from the team, we agreed to do a massive A/B test. Half the users would be ‘assigned’ to a 14-day full access trial, and half the users would get a freemium account, just like before. Here are the details on each set of plans:
OLD PLANS – FREE MODE
Free: Up to 5 presentations. No export or branding. Limited templates.
Advanced ($19/mo): Unlimited presentations. Exports. No Branding. 3 Users.
PRO ($29/mo): Unlimited presentations. Exports. Branding. 5 Users.
NEW PLANS – TRIAL MODE
NO FREE VERSION: JUST A 14 DAY TRIAL
Espresso ($19/mo): All Features. 1 user.
Macchiato ($29/mo): All Features. 5 users.
Cappuccino ($49/mo). All Features. 10 users.
Implementing this required:
– Redirecting traffic through Optimizely.
– Creating a ‘trial’ type of plan that the app would interpret as an expiring plan.
– Building a separate on boarding process for the trial users, with a whole new set of emails.
– Training our support team to make sure the wording was correct depending on the user type.
Since the trial expired after 14 days, we needed to wait at least 30 days after starting the test: we needed sufficient users with a completed trial and a grace period after it to measure conversion. This is the data that we gathered, based on roughly 4,000 sign ups:
Activation Rates (users that completed multiple presentations):
Users on Trial Mode: 9.42% (winner)
Users on Free Mode: 6.95%
Historic Benchmark: 6.42%
> Enabling all features was causing a ~50% improvement in activation rates. Great!
Conversion to Paid (from total SignUps)
Users on Trial Mode: 1.42%
Users on Free Mode: 2.35% (winner)
Historic Benchmark: 2.64%
> Wait? Better conversion rate on the free plan?
We also measured the average MRR per signup, it looked like this:
Users on Trial Mode: $0.22
Users on Free Mode: $0.56 (winner)
> Wow. That’s less than half!
And finally, churn rate…
Users on Trial Mode: only one cancellation in over 30 days! (winner)
Users on Free Mode: same as before, ~18%
We made a list of the insights that we got from the data:
- 1. Better Activation Rate | Access to all features was helping users see the value in the product.
- 2. Worse Conversion to Paid | Users would use all the features, export and leave. This was confirmed by looking at the number of presentation exports.
- 3. Worse MRR per User | Users who were presented with new plans were subscribing to the cheapest (individual) plan, while users on the old plans selected the high end plan, because it provided them with full features.
- 4. Lower Churn Rate | Users were not canceling because they knew they would lose access to their work.
The rest is history. In early September we used our conclusions to merge the free and trial plans into a single hybrid plan. We addressed each one of these conclusions in the following way:
- Plan mode: Trial, with access to all features except exports (addressing above points 1 and 2).
- Plan Options (solving point 3).
- Espresso ($19/mo): 1 user. Exports enabled.
- Macchiato ($29/mo): 5 users. Exports and Branding enabled.
- Cappuccino ($49/mo). 10 users. All Features Enabled.
- Mocha ($99/mo): 25 users. All Features Enabled.
- Latte ($199/mo): 50 users. All Features Enabled.
- Finally, simulating Mailchimp’s model, we decided that an active plan was required to gain access to an account. If you cancel, your account locks out until you reactivate it (solving point 4).
Therefore, we ended up with this:
PRODUCT: Slidebean: presentations that design themselves
MARKET: B2B – Small Businesses
BUSINESS MODEL: Premium platform, plans from $10/mo to $200/mo. In September and October, we registered our lowest churn rates and our highest conversion rates ever.
Looking back on this 2 year process of growing Slidebean, we wish we had chosen to pivot sooner. Resources are limited and any month of operations that you spend heading in the wrong direction can take a bad toll on your company. Here’s an article about how we spent our first $250,000 in funding.
Deciding when and how to pivot is crucial and the only reason we’ve been comfortable doing it has been because of how closely we measure the data. All the data that you gather can often be overwhelming, so make sure that you identify the KPIs that you want to track and avoid any other distractions if possible. Track everything, analyze later and make educated decisions.
Apply to be a part of our next batch of startups in 500 startups.
.jpg)

Let’s move your company to the next stage 🚀
Pitch deck software
Pitch deck services
Start a project
Financial Model Consulting for Startups 🚀
Raise money with our pitch deck writing and design service 🚀